Marketing Analysis
Not all customers are equally profitable, nor do they all have the potential to become your most profitable customers - this is a fundamental tenet of CRM. This section hopes to help you identify your most profitable customers. We cover methodologies for categorizing customers and focusing on those who make the largest contributions to your bottom line; and how to analyze your CRM and Marketing campaigns - both off-line and online.
Program Profitability
Weighing Program Profitability is very similar to that of measuring customer specific lifetime value - the inputs are just a little broader. Depending on the nature of your program, a comprehensive costing study maybe appropriate. An example of an online loyalty program's profitability exercise.
.
Lifetime Value
Lifetime value (LTV) is used to answer the question of how much a CRM marketer can afford to spend to acquire a new customer - and still make money on that customer. This is the most basic of analysis that should be performed on your customers. In order to undertake this study, you will need to know (or have a reasonable estimate of) how long a new customer will remain with you, what purchase behavior will this new customer have over the lifetime of the relationship and what the margins of the business are. LTV can be performed on the customer base as a whole or used for segmenting customers.
Fidelity Investments, for example, classifies its customers into more than 10 segments based on their profitability to the company. Centura Banks of Raleigh, N.C., now rates its 2 million customers, with top customers getting special attention from service reps and senior management, including an annual call from the CEO. This has reduced customer attrition by 50% in the last five years and has trimmed the number of unprofitable customers by 6%.
Here are three LTV examples: an excellent one from Sunil Gupta and Donald Lehmann who walk their readers step by step (![]() ) in calculating lifetime value, an example from an established retailer and another from a dot com's e-mail program.
) in calculating lifetime value, an example from an established retailer and another from a dot com's e-mail program.
Lifetime value for loyalty program measurement is similar. The primary difference is that acquisition cost usually do not play a role in the formula as it is considered a "sunk cost" (you already have these customers/members). Also, analysis should be performed on a group level in a test vs control situation (test gets the loyalty program, control doesn't). The loyalty program investment will obviously need to increase the lifetime value by an amount which more than offsets the cost of the investment to be deemed a success.
On the web, this is a fun LTV calculator. This calculator does not use any sort of NPV (net present value) calculation. For a more involved LTV calculation, see the two examples above.
Basic Segmentation

In today's hyper-competitive environment, marketers must significantly improve the impact of every CRM marketing dollar spent. Marketers can do this by utilizing their database to communicate the right offer to the right people, at the right times. Cluster analysis, factor analysis and regression and correlation analysis are often used as a first step to measure and identify market segments having the most relevance to a particular organization.
Here's a paper by Peppers & Rogers Group ![]() (PDF) that may help get the juices flowing on how to segment your customer base (like so many consultants, they prefer to raise questions than give answers).
(PDF) that may help get the juices flowing on how to segment your customer base (like so many consultants, they prefer to raise questions than give answers).
Segmentation typically takes one of three forms:
- Reductive - demographics, geographic (e.g. Age, Income, Gender, Region)
- Attitudinal - psychographics (e.g. Empty Nesters, Psyte Clusters)
- Behavioral - lifestyle, buy cycle
Reductive and attitudinal segmentations tend to rely upon more historical information whereas behavioral segmentation tends to rely upon more recent data. The nature of your business will likely dictate how sophisticated you will need to be in your segmentation. Your segmentation can be as basic as defining a primary, secondary and tertiary customer; RFM (recency, frequency and monetary), decile analysis (the old "80/20 rule" - 20% of your customers represent 80% of your revenue); share of wallet, cluster analysis (statistical segmentation); attitudinal; predictive; or some other scoring system of your own design. We will attempt to address all these below.
RFM
RFM gained prominence in the fund raising arena. With that said, it is often used in CRM to segment. A simple Excel sheet example of RFM scoring in the nonprofit area is available here. Once you have scored your customers/donors, you can then devise a mail plan (investment decisions can be made based on RFM score) based on RFM and customer/donor status (e.g. lapsed). High score customers/donors can be profiled and used to target rented lists for customer/donor acquisition.
- Pros
- Simplifies selections
- Low budget alternative to predictive modeling
- Will be better than no segmentation
- Cons
- May be missing other important predictors
- Weighting of variables arbitrary
- RFM variables are not typically available for prospecting lists
- More verification driven than discovery driven
Decile
Deciling your customer base is another popular segmentation tool (see example) used by CRM professionals. Based on decile and identified best customer clusters, further analysis can be undertaken. One B2B long distance carrier found that 70% of revenues expected to be lost to customer migration to other long distance carriers could be isolated to 10% of their current customer base. Result: more focused, relevant retention initiatives.
While deciling is fairly simple to undertake, it is somewhat arbitrary in forcing your customers into 10 segments and determining which segments will be considered primary, secondary and tertiary segments
Share of Wallet
Developed by former Harvard Business School professor Tom Jones and further developed and evangelized by CRM marketer Craig Underwood, the share of wallet or Marketing Opportunity Matrix (see example) segments customers by cross-analyzing their current degree of loyalty/spend to a company with their potential value. Popular in the grocery industry, the potential value criteria is determined by the size of household (arguably a household of four or more persons will spend more on product than a single person household).
Cluster Analysis
Cluster analysis is a conceptually simple and technically slippery methodology applied in many areas of CRM marketing. The simple concept: create clusters (groups) in such a way that members of each cluster are relatively similar to each other and relatively different from members of other clusters. Its most common application in marketing is the identification of customer clusters although there are several other uses. You will likely need a professional well versed in statistics to help out in this area.
Advanced Segmentation
|
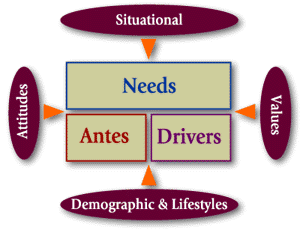
To realistically define, understand, reach and communicate with your customers, it is important that any research conducted deal with consumers on four relevant levels: 1) Geodemographics |
 |
All four factors integrated will form a picture of who your real customer is, where they live, the way they live, their attitude toward life, their perceptions, attitudes and values toward products and services and their selection.
Attitudinal
The theory behind attitudinal segmentation is that it will allow the CRM marketer to create direct marketing messages that speak specifically to an individual's attitudinal motivations, not just their demographic profile. Attitudinal segmentations are commonly used and are usually developed from primary research after some initial data segments have been established (See Data Overlays). Because of the time and resources involved, this is one of the least used of data types.
To join the few and the proud, the initial step is to segment your customers. This can be as basic as RFM, deciling or some other schema of your choosing. Create 3 - 5 segments.
Next, overlay the segments/groups with demographic, attitudinal and lifestyle data. The attitudinal and lifestyle data is gathered by selecting a random sample of names from your house file and administering a survey questionnaire containing attitudinal and lifestyle questions. By combining the answers to these questions with the geodemographic and purchase behavior data already on file, clusters can then be developed. You should be able to create 4-8 relatively homogeneous segments - the key distinguisher being their different needs and wants.
Once this has been accomplished, two analyses are critical:
1) the percentage of the customer file that comprises each cluster
2) The percentage of primary, secondary and tertiary customers that comprised each of the clusters
The final step consists of developing a profile comparing your customer file and a representative sample of consumers from a national consumer database to determine if your penetration of each segment is representative of the general population. You may be over or under represented in certain segments, which may be good or unveil potential problems in your customer acquisition strategy.
Predictive

Predictive modeling looks at many more variables than the basic segmentation schemas mentioned above. Variables are sought out that may or may not relate to the behavior being modeled (no assumptions). Meta data is created and variables are then fed into a statistical engine (degrees of sophistication range from basic regression to neural networks). The output tells the CRM marketer which variables are most important and need to be checked against business rules. The output also provides a formula for scoring every record. The scores are then calibrated against a sample of data that was not used to create the model.
If done correctly, this can be a very powerful tool for everything from acquisition to churn reduction. You will need a well versed statistician to assist. Up front data processing can be costly. The models will require a high degree of scrutiny and unfortunately, tend to go stale fairly quickly and therefore need to be refreshed often.
Lifestage/Lifecycle

Lifestage marketing has been a buzz term in recent years as a method of targeting consumers (see also Data Overlays) and characterizing consumer behavior. In Lifestage marketing, consumers tend to go through four distinct phases:
1) Transition Stage
2) Early Stage
3) Expansion Stage
4) Mature Stage
From a marketer's perspective, the key questions will be: "what are the target Lifestage groups? Within each stage, what are the purchase triggers?"
While Lifestage marketers have the opportunity to identify and market to consumers in anyone of these stages/phases; the transition stages are the times when consumers are most likely to try new products and marketers have the greatest opportunity to convert these individuals to lifetime customers. Transitions include everything from graduating, getting married/ remarried, getting divorced, becoming parents and grandparents, moving, changing careers, becoming caregivers, and retiring.
|
Transitions can be hard to predict and thus care must be taken not to offend customers by assuming they are undergoing something they are not or by scaring customers by adopting a 'big brother' approach. To prevent this, as much information as possible should be gathered from both existing data and from regular communications with customers. There are several reasons why a company may not want to develop a Lifestage strategy. Not least of these is the investment in the technology that will allow them to do so. A common complaint of older players is that once the data has been through various internal systems, useful data can be destroyed through the production of average values that provide little insight into consumer behavior. Cultural change (a.k.a. flexibility) is also required to switch from a product focus to a more customer-centric approach. Lifestage marketing is more applicable to some products than others. The traditional product focus of financial service providers has typically fueled a very rigid product offering to customers. This design is not considerate of customer needs and does not reflect that people's needs are constantly changing. This flux in the marketplace should be seen as an opportunity for companies to gain business and develop stronger relationships with their customers. For example, people are less likely to stay in the same job for life, which presents companies with an opportunity to provide personal pensions, and help them through times of unemployment. It is true that Lifestages are becoming less predictable. However, their use can give an indication of what people are likely to want/do. The age bands where events typically happen are becoming more elastic and cultural changes are leading to more Lifestages - divorce is increasingly important and people are living longer, making the elderly a much larger, significant group for companies to consider. People are generally only actively making a decision in a very short amount of time. By being more able to predict these decision points, for example by picking up changes to normal spending patterns, companies can increase their chance of successfully securing business. Many of these times will be as people enter new Lifestages, and as such careful identification of these will be necessary. By providing support and giving valuable advice over these periods, long-term, trusting relationships can be built. In the 2000 U.S. census, there was a 314% increase in the number of same-sex partner households compared to 1990. A similar trend has also been found in France. These consumers present a further challenge the general understanding of Lifestage. So what can we do in the light of these changes - especially as the traditional path through life becomes narrower? The reality is that companies will face two options in the future. Either abandon the concept of Lifestage altogether and focus purely on attitude, or adapt the new stages and complexity of consumers' lives into their approach. |
Retention Rate
The retention rate provides a snap-shot of how many customers are staying loyal to you from year to year:

R = the year over year retention rate percentage
x = the number of customers still buying in year two
y = the number of customers who bought in year one
Example - 150,000 customers made a purchase from Company X in 2003. Of those, 97,300 also made purchases in 2004. The formula above, for this example, calculates a 65% retention rate:
97,300 x 100 = 65%
150,000
Taking this to the next step, that equals a customer lifetime of 2.86 years.

C = customer lifetime (in years)
R = the year over year retention rate (percentage)
100 = 2.86 years
100 - 65
NOTE: "Customer Lifetime" should NOT be confused with "Customer Lifetime Value" which represents the net present value of all future contribution to income and overhead from the customer. This was addressed above.
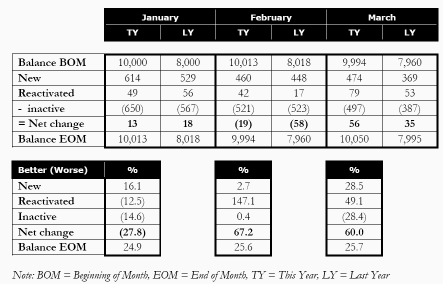
Reporting on customer retention should be a MUST for all companies. An example of one such report is below:

Source: Brian Woolf, Retail Strategy Center
The above report shows the number of active customers at the beginning of the month (or in this example - have purchased at least once in the preceding 3 month period), how many are first time customers during the month, how many reactivated in the month (i.e. those who had shopped before but not during the preceding 3 months), how many became inactive that month (i.e. not shopped in the last 3 months), and the resulting balance (i.e. the number of active at the end of the month).
Therefore, in the example above, 10,000 active customers are listed at the beginning of January (i.e. had shopped at least once during October, November and December). The 49 reactivated customers are those who had shopped prior to October.
The 650 listed as inactive at the end of January were those who had not shopped in the 3 months November to January. As the inactive customers were included in the active customers total at the beginning of January, it means that their last shopping trip was in October. Thus it follows that the 10,013 customers at the end of January comprises only those who purchased at least once during the 3 months of November to January.
Data Overlays

Data overlays have become quite common in helping CRM marketers not only have a better understanding of their customers but also in trying to acquire new customers. Overlays are used in everything from basic segmentation to Lifestage marketing. Companies that provide overlay information include:
Claritas The industry standard for lifestyle segmentation, Claritas classifies every U.S. neighborhood into one of 62 distinct PRIZM clusters e.g. "Sophisticated Townhouse Couples" and "Bohemian Singles & Couples"
Acxiom's InfoBase offers a sophisticated suite of overlay and analysis products - everything from response data, demographic, geographic, purchase and lifestyle. This data is available for not only direct mail but also telemarketing.
InfoUSA FormerlyDatabase America, offers a comprehensive family of list enhancement services for both Consumer and Business programs. They offer 61 consumer data types and 13 business data types. While they do offer overlays, their main forte is list prospecting.
MapInfo's Psyte neighborhood segmentation system is a proven and easy to use tool for analyzing and predicting lifestyle and consumer behaviors at the neighborhood level. Good tool to overlay on your data.
Equifax Sophisticated suite of analysis, reporting and mapping tools available. Through geocoding, Equifax's has classified the US into 50 segments. They also offer more sophisticated overlays, segmentation and predictive tools.
Trans Union is a good stop if you have any desire to work with credit data.
Experian The owners of Metromail, Experian offers a suite of services that includes everything from address hygiene to letter shop to data modeling.
Lifestage Matrix Marketing - Consulting company that specializes on generational cohort segmentation.
Sample Size
| This is an area even the best marketers screw up. If you have a test cell of 10,000 individuals with a response rate of 3% and a control of 5,000 individuals with a response rate of 2.5% - that doesn't mean that your test cell had a 20% better response rate. Reason? The size of the test cell was not statistically significant. A number of factors will affect your sample size: 1) variability of the population within the two cells (you want the two populations to be as similar as possible) 2) Response rate expected 3) Confidence level. |
 |
Our Excel spreadsheet is an excellent tool for determining sample size and the statistical significance of response rates (note there are three tabs).
Campaign Analysis
ROI
|
ROI (Return on Investment) involves looking at the cost of a marketing campaign relative to the profit generated. This is a favored calculation by CRM marketers for determining whether a specific marketing campaign or program should be deemed a success. What constitutes a success will be specific to your company. Here is a typical example of a DM post analysis and its ROI. |
 |
On the web, this is a fun ROI calculator
ROI is also often used to justify technology expenditures (registration required at this site). With that said, the ROI on technology doesn't always add up.
Response Rates
Response rates will vary depending on the list you're working with (house vs. prospect), the industry you're working in, your offer and the objective (purchases, donations, lead generation, traffic generation) of your campaign. We have worked on a surprisingly varied list of campaigns over the years, and response rates have varied quite a bit. Based on what we deem to have been typical Consumer campaigns, below is an outline of results:
| Medium |
High |
Low |
Typical |
| Direct Mail |
1.9% |
0.12% |
0.9% |
|
25% |
0.1% |
1% |
|
| Catalog |
3% |
0.05% |
1.2% |
| Freestanding Inserts |
1.5% |
0.002% |
0.3% |
| Coupons |
1.5% |
0.009% |
0.05% |
| Outbound Telemarketing |
9% |
0.09% |
0.16% |
| DRTV |
0.8% |
0.13% |
0.2% |
| Radio |
0.6% |
0.012% |
0.15% |
In direct mail, 21 days into a mailing you should know directionally how the mailing is going. Forty-five days into the mailing you should have 90% of your responses.
Are your responses statistically significant? Use our nifty Excel tool to find out.
One interesting phenomenon that occurs periodically is the issue of negative lift. That is to say, your control group had a higher response rate than your mail group. While a wag will be quick to point out that you must have done something wrong - we are here to tell you that, it does happen. And it happens to some of the most sophisticated marketing organizations. IF this happens to you, a couple of things to consider:
a) Is the negative lift statistically significant?
b) Were the mail and control cells chosen at random?
c) Even if the mail and control cells were chosen at random, take a second look at the cells. There may be more variability within the control cell than one may think - thus explaining why the control out pulled the mail cell
d) Was there market noise that could have affected the control cell i.e. other divisions within your organization that were mailing or contacting your control cell, advertising in market, competitor mailings/activities etc?
e) Looking at the creative, was there something in there that suppressed response? As you know, we are huge fans of the 98% rule.
After all is said and done, look out beyond the promotional period and continue to measure performance (going beyond the myopic response rate). You may find solace in the fact that the mail cell, with its lower response rate, actually performs better over the longer period.
In closing this discussion on response rates, keep in mind that creative will only affect about 20% of your response rate. The other 80% will be list and offer. Even with that in mind, response rate is only part of the equation. Other elements that go into calculating the success of a campaign are items such as a fully loaded cost per response, average ticket size/donation, LTV.
For a more comprehensive look at response rates by industry, consider ordering the DMA's Response Rate Study.
Mean, Median & Mode
When reporting, sales, response rates - or any statistics, "mean" (otherwise known as the "average") is the most often seen number e.g. 'Average sales per transaction at Company X are $100.' While this number has its purpose, it is the statistical number that is most likely skewed by anomalous data. As such, the median (the middle number found in a rank order of values) is the most worthwhile and less likely skewed number that should be used in reporting. The median always results in 50% of the values being above it, and 50% of the values being below it. It does not matter how high the extreme skews are as the median will provide the most reasonable figure. The only instance where median can be misleading is where values are polarized into very high and low bands with 50% of values falling into one band and the rest falling into the other band. In such instances, the mean calculation may prove more reliable.
Modes are generally only useful where there are a limited number of different values within the data e.g. 1-5 grading systems used in research surveys. In such cases, the mode is a useful tool.
In keeping with our site's mission to represent CRM best practices, we reiterate our call that should you come across content and links that, in your opinion, represent the best of the Internet, we strongly encourage you to pass them along so we can continue to keep our community abreast of the latest and best.
The CRMTrends Team
